Skip Navigation
Jump to bottom of the page
Home
Agency
Digital
Design
Website
Support
Our Work
What’s Happening
Contact
Privacy policy
|
Terms of use
Want to learn more about our services? See some of our Blogs:
- Blogs -
To ChatGPT or to not ChatGPT, That is the Question
...
Read more
- Blogs -
4 Social Media Trends for 2023
...
Read more
What's Happening
All
Blogs
5 Inspiring Graphic Design Trends for 2023
Read more
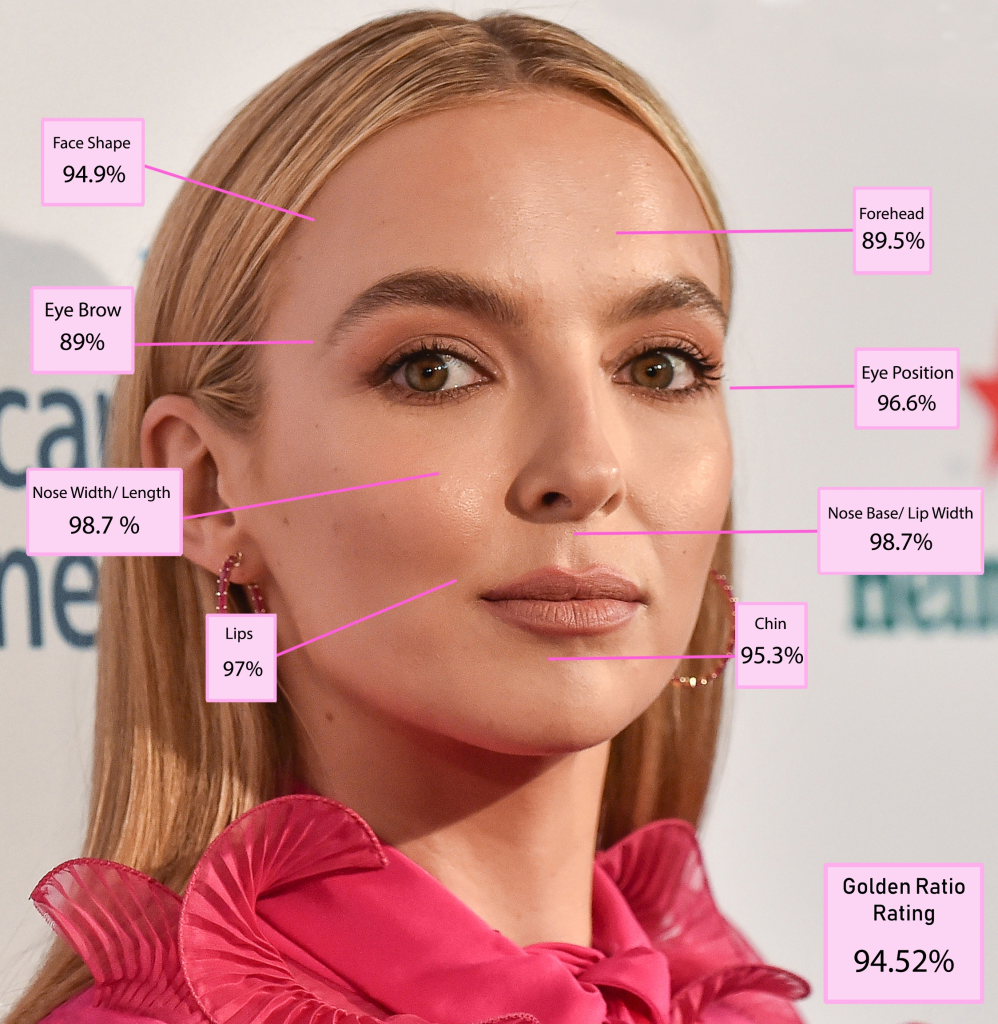
Jodie Comer and The Golden Ratio
Read more
How AI is Transforming the Conference Space
Read more
Inspiring Design Trends for 2022
Read more
Top 5 Social Trend Predictions for 2022
Read more
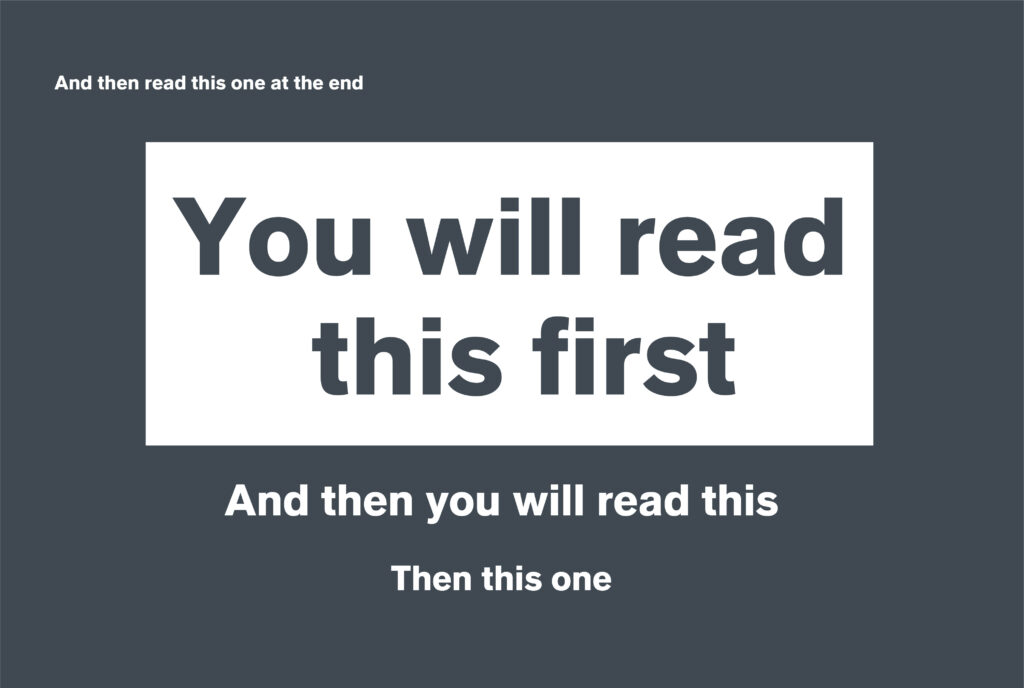
The Importance of Text Hierarchy
Read more
Social Media in 2021
Read more
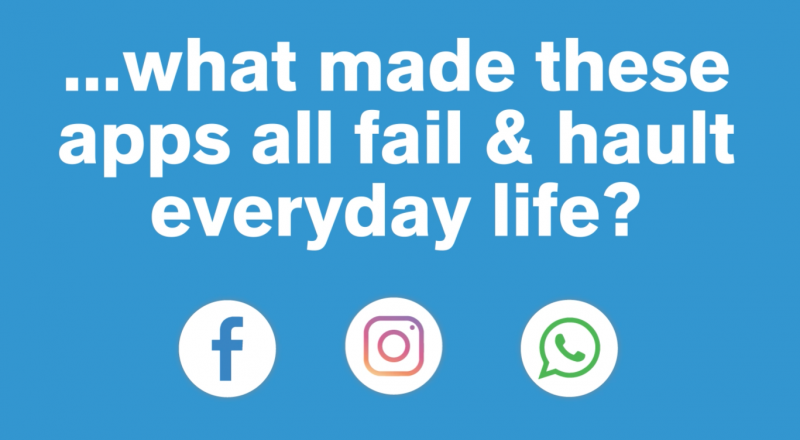
What Made the World Stop?
Read more
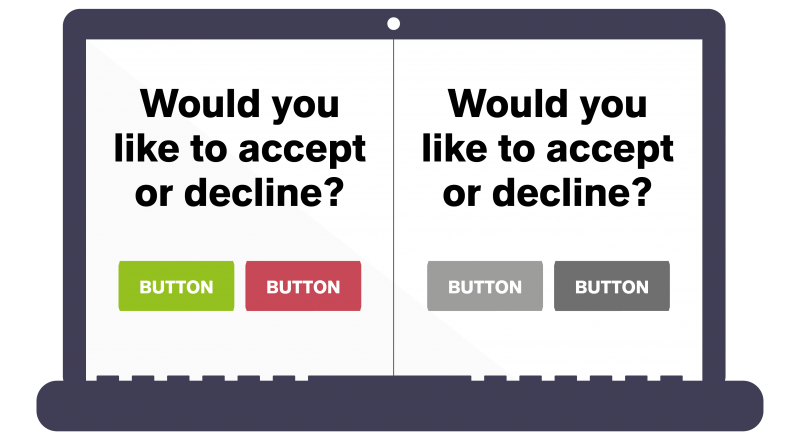
Why is Web Accessibility Important and How is it Carried Out?
Read more
AI in Marketing
Read more
Posts navigation
Older posts